
Our research team releases regular monthly housing trends reports. These reports break down inventory metrics like the number of active listings and the pace of the market. In addition, we continue to give readers more timely weekly updates, an effort that began in response to the rapid changes in the economy and housing as a result of the COVID-19 pandemic. Generally, you can look forward to a Weekly Housing Trends View and the latest weekly housing data on Thursdays with a weekly video update from our economists on Fridays. Here’s what the housing market looked like over the last week.
What this Week’s Data Means:
While the monthly housing data showed a still-closing gap in time on market in July, with homes sitting for 35 days, 2 days faster than in July 2021. The weekly data shows that homes are taking longer to sell than they did at this time last year for a second consecutive week. As the housing market pivots, homebuyers and sellers using data to evaluate their real estate decisions will want to pay close attention to the time period any figures describe to consider how best to weigh the information against current conditions. Realtor.com weekly and monthly Housing Trends reports share timely updates, and local real estate agents can help consumers evaluate how these trends should factor into their pricing and offer strategies.
The housing market is resetting in a buyer-friendly direction, and while the improvement has been substantial, buyers in today’s market may still face meaningful affordability challenges as the typical home listing price remains near a record high, at $449,000 in July, and weekly data show that double-digit growth continues. Persistent homeowners may still continue to find success, as second quarter data showed that homeownership rates increased from a year ago both overall and for nearly every age and racial/ethnic group. One factor driving the success of homeshoppers is an incredibly strong labor market that is pushing up wages and giving workers the ability to negotiate remote or hybrid working arrangements, even as in-person work is growing more common. With flexible work arrangements still available, home shoppers are able to consider homes further afield of the office, in the more affordable suburbs or even in a new, less expensive state altogether, enacting their own personal plan to combat cost-of-living increases.
Key Findings:
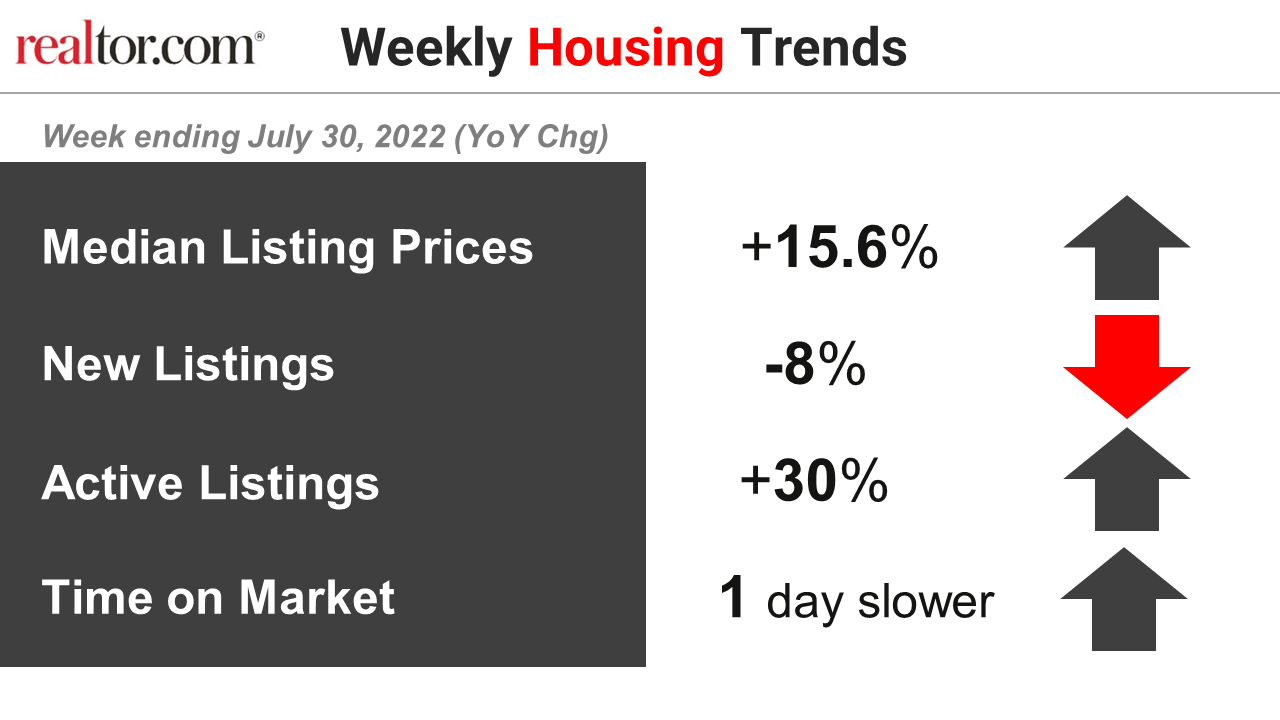
- The median listing price grew by 15.5% over last year. The typical asking price of for-sale homes was up from last year by double-digits for a 34th week, a second consecutive week of deceleration. The weekly trends have bounced up and down recently, but a bigger deceleration trend is evident in the monthly data, which in July marked the second consecutive month of slowing price growth. Even though the median asking price slipped to $449,000, down $1,000 from its June all-time high, the measured year-over-year advance in July–16.6%–remains well above what’s typical.
- New listings–a measure of sellers putting homes up for sale–were again down 8% from one year ago. This week marks a fifth straight week of year over year declines in the number of new listings coming up for sale, suggesting that fewer homeowners are eager to list homes for sale in this rebalancing market. Many of the indicators we track signal that the housing adjustment is already underway, and sellers appear to be getting the message. If sellers hesitate to wade into the market amid a declining sense that now is a good time to sell, that could slow the housing refresh, and it may take longer for balance to return. Homeowners still on the fence about selling however should consider that with home equity at a record high, they are likely in a fairly strong position. To see what market conditions mean for the equity and value of your home, visit the My Home dashboard on Realtor.com.
- Active inventory continued to grow, but the pace slipped to 28% above one year ago. The rate of improvement actually slipped this week as the number of new listings continues to come in lower. The big positive for today’s shoppers is that they have more homes to consider than last year’s shoppers did. Nevertheless, our July Housing Trends Report showed that the active listings count still trails its 2020 and 2019 levels by more than 15% and 45%, respectively. More improvement in active inventory is likely needed to bring balance, but the recent trend may be at-risk if homeowner attitudes toward selling now continue to deteriorate.
- Homes spent three extra days on the market compared to this time last year. After last week’s first year-over-year increase in time on market in over two years, the gap grew larger this week. We expect more slowing ahead as the housing market resets as both buyers and sellers adjust to higher mortgage rates. And the data highlight how dramatically this metric has shifted. As recently as February 2022, the Realtor.com Housing Trends report showed that homes sold more than two weeks faster than in the previous year. In the June Housing Trends Report homes spent 4 fewer days on the market than one year ago, and in July the gap shrank to just 2 days. The weekly data has now shown 2 weeks of gains, suggesting that increases in time on market in the monthly data is not far off.
Data Summary:
| All Changes year-over-year | Year-to-Date 2022 | Week ending July 23, 2022 | Week ending July 30, 2022 | Week ending Aug 6, 2022 |
| Median Listing Prices | +14.7% | +16.6% | +15.6% | +15.5% |
| New Listings | -1% | -6% | -8% | -8% |
| Active Listings | -2% | +30% | +30% | +28% |
| Time on Market | 7 days faster | 0 days faster | 1 days slower | 3 days slower |
Subscribe to our mailing list to receive updates and notifications on the latest data and research.